GoCharting Platform
Advanced Features Built for Every Trader
From professional charting tools and order flow analytics to live options trading — GoCharting is the most complete platform for serious traders.
| CALLS | STRIKE | PUTS | ||
|---|---|---|---|---|
| OI | IV% | OI | IV% | |
| 47K | 18.7% | 19400 | 18.7% | 15K |
| 32K | 16.2% | 19450 | 16.2% | 29K |
| 66K | 14.5% | 19500 | 14.5% | 73K |
| 23K | 16.5% | 19550 | 16.5% | 39K |
| 18K | 19.0% | 19600 | 19.0% | 51K |
Advanced Options Chain
OI, IV, Delta and 30+ metrics on the chain — filter, sort, and trade directly.
Strategy Payoff Charts
Visualize max profit, max loss, and breakeven for any multi-leg options strategy.
| ── CALLS | Strike | PUTS ── | ||||||
|---|---|---|---|---|---|---|---|---|
| OI | Δ | Γ | Θ | Strike | Θ | Γ | Δ | OI |
| 975K | 0.94 | 0.0002 | -1.62 | 22100 | -1.62 | 0.0002 | -0.06 | 475K |
| 1.0M | 0.77 | 0.0006 | -3.19 | 22200 | -3.19 | 0.0006 | -0.23 | 462K |
| 191K | 0.62 | 0.0019 | -6.09 | 22300 | -6.09 | 0.0019 | -0.38 | 575K |
| 308K | 0.47 | 0.0022 | -7.44 | 22400 | -7.44 | 0.0022 | -0.53 | 519K |
| 533K | 0.31 | 0.0014 | -5.20 | 22500 | -5.20 | 0.0014 | -0.69 | 207K |
| 561K | 0.16 | 0.0004 | -2.58 | 22600 | -2.58 | 0.0004 | -0.84 | 468K |
Options Trading and Analytics
World's most beautiful Options Trading Platform on the web.
- Advanced and customizable Options Chain
- Options Flow and Open Interest Analysis
- Add 30 pre-built metrics on the Chain
- Trade directly from the Chain with ease
Net GEX All Expirations · NIFTY
Gamma Exposure & More
Advanced analytical metric on GEX, PCR, OI and more.
- Gamma Exposure based on OI and Volume
- Cumulative OI Analysis
- Put/Call Ratios
Underlying Price at Expiry
Strategy Analyzer and PayOff Chart
Create complex option strategies on the fly and analyze PnL in Paper/Real Trade mode.
- Create custom strategies saved on the cloud
- 40+ pre-built popular option strategies
- Interactive PayOff Chart
- Greek overlay curves to the PayOff chart
Strike Price
Volatility Skews and Surface
Implied Volatility is never flat — it smiles, smirks and shifts across strikes and expiries. The GoCharting volatility surface lets you see exactly where the market is over- or under-pricing risk and exploit those edges.
- IV Skew chart — compare implied volatility across all strikes in one glance
- Multi-expiry overlay — plot 30d, 60d and 90d curves simultaneously
- 3D volatility surface — scroll and rotate the full strike × expiry landscape
- Historical vs. current IV comparison to spot regime changes
- Term structure view — see if front-month IV is elevated vs. back month
- Identify mispriced options where skew deviates from fair-value model
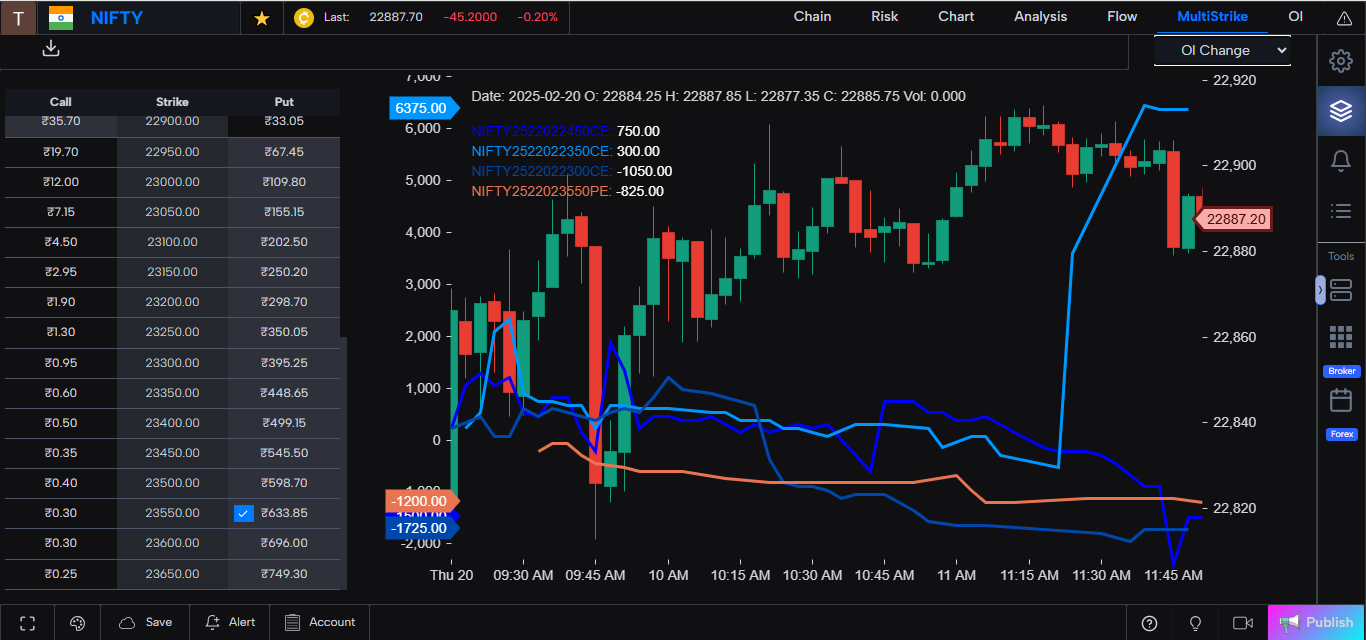
Multistrike Charts
Multistrike Charts uniquely fuse options analytics with GoCharting's world-class orderflow tools — plot OI, volume and delta for multiple strikes directly on a price chart in one unified canvas.
- Overlay Open Interest for any strike on the underlying price chart
- Compare Call vs. Put OI build-up at key strikes side by side
- Add volume and delta series for each strike as separate sub-panels
- Combine with Footprint and Market Profile for full-context reads
- Automatically highlights max-pain and gamma-heavy price levels
- Trade directly from the chart without switching to the chain view
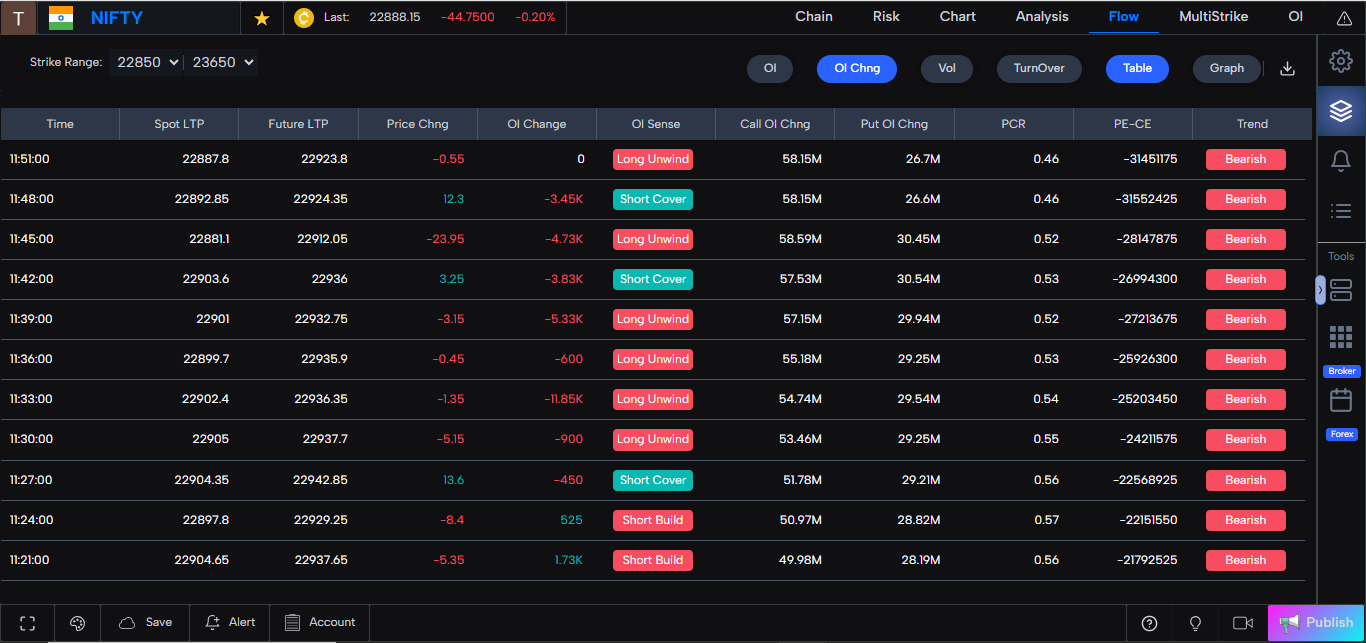
Options Flow
Options Flow is real-time intelligence on what smart money is doing. Track where fresh OI is being built, where large premiums are changing hands, and which strikes are attracting unusual activity — before the move happens.
- Real-time OI and Volume flow streamed tick by tick across all strikes
- Unusual activity scanner — flags prints significantly above average size
- Net premium flow — total dollars transacted on calls vs. puts per expiry
- Block trade detection — highlights large single-transaction option buys/sells
- Historical flow comparison to gauge whether today's activity is elevated
- Filter by expiry, strike range, premium size and call/put direction
Frequently Asked Questions
OptionsDesk is GoCharting's dedicated options workspace. It combines an advanced options chain with 30+ metrics, live Greeks, open interest and gamma exposure analytics, a multi-leg strategy builder with an interactive payoff chart, volatility skew and surface tools, and one-click trading directly from the chain.
OptionsDesk covers index and equity options across supported exchanges, including NSE (NIFTY, BANKNIFTY and F&O) and other global markets available through connected data providers. Underlyings such as NIFTY are analysed with real-time chain, OI and IV data.
Yes. Build any multi-leg strategy from scratch or choose from 40+ pre-built templates. The Strategy Analyzer plots an interactive payoff chart with max profit, max loss and breakeven, and lets you overlay Greek curves and test PnL in Paper or Real Trade mode.
Yes. Connect a supported broker to place and manage option orders straight from the chain and strategy builder. Without a broker linked you can still use every analytics tool and simulate trades in Paper Trade mode.
You can explore the options chain, Greeks, payoff builder and volatility tools for free. Advanced real-time data feeds and higher usage limits are available on paid plans — see the pricing page for details.
Trade Options Like a Pro — All in One Platform
Options chain, payoff builder, live Greeks, IV surface and one-click multi-leg execution. Connect your broker and start in minutes.
Explore More Features