Browse Lipi Scripts · Trading Strategies · Custom Indicators
Community Trading Scripts & Custom Indicators
Browse trading scripts, custom indicators, and Lipi strategies published by the GoCharting community. Filter by asset class, access type, and more.
 Protected
FVG Indicator
This indicator plots the fair value gaps and Inverted Fair value gaps. There is an option to select the number of bars till which the FVG has to be tracked. There is also an option to select the number of FVG bars on each side.
 Protected
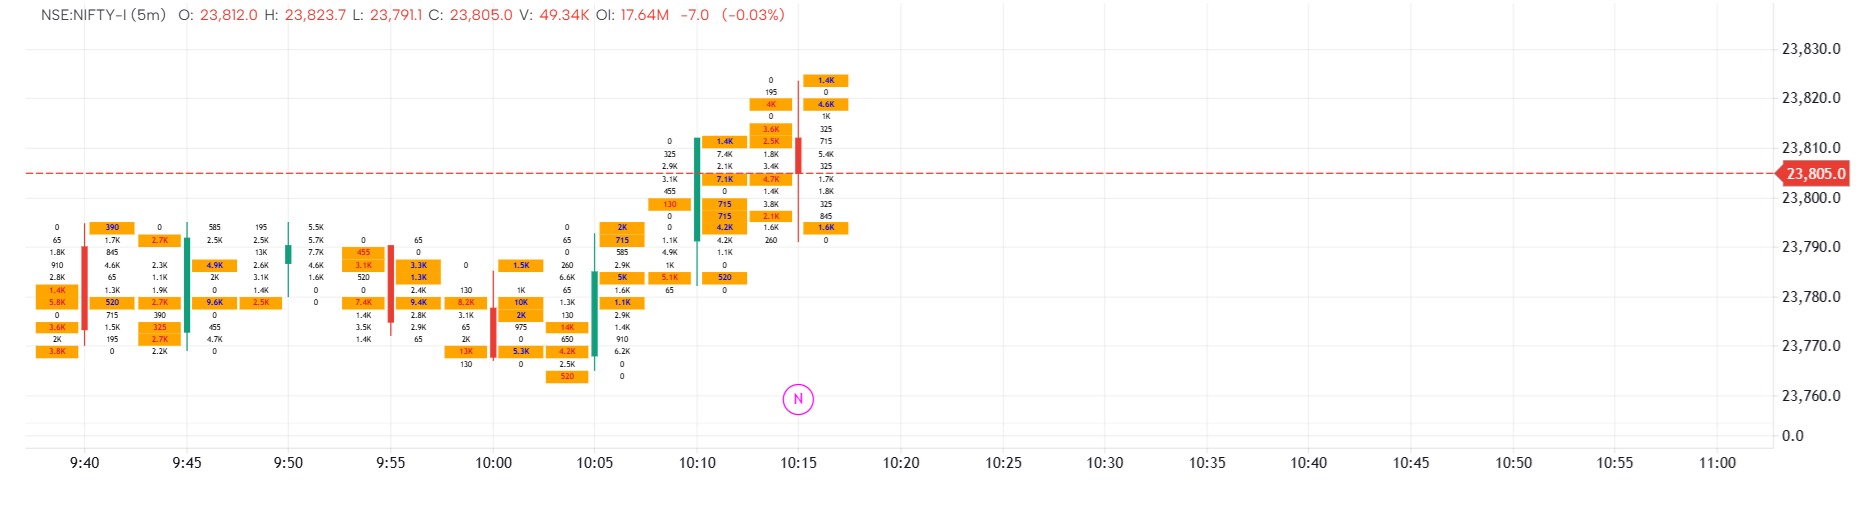
Support and Resistance
This indicator plots the support and resistance level based on the pivot levels reached. There is an option to increase the pivot strength, and maximum lines per side can also be configured. If a level is broken you can display or remove it.
Critical Delta & Volume Candle Finder
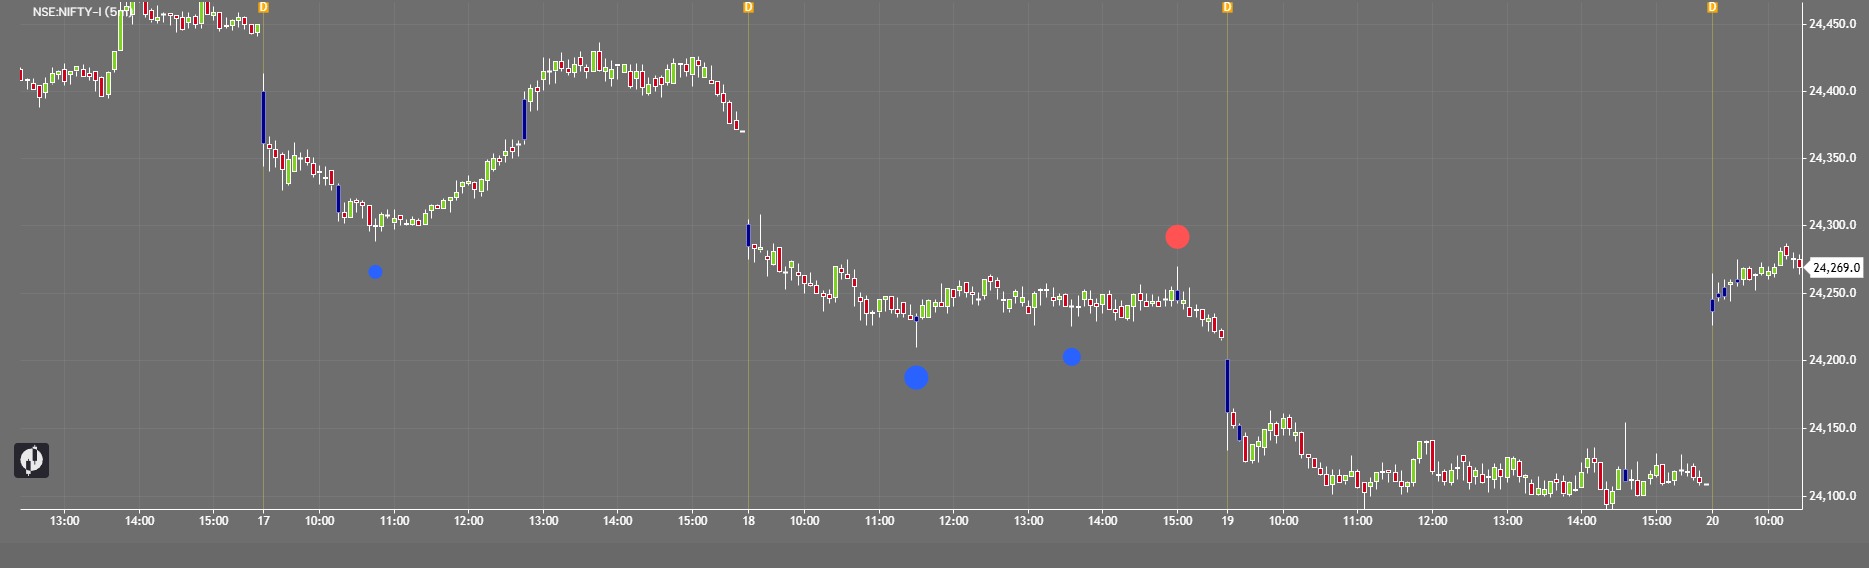
Find critical volume candles and identify potential breakout or breakdown zones with ease. Set the Volume or Delta threshold according to your trading strategy — when the candle's volume crosses your selected level, it is automatically highlighted in blue.
 Protected
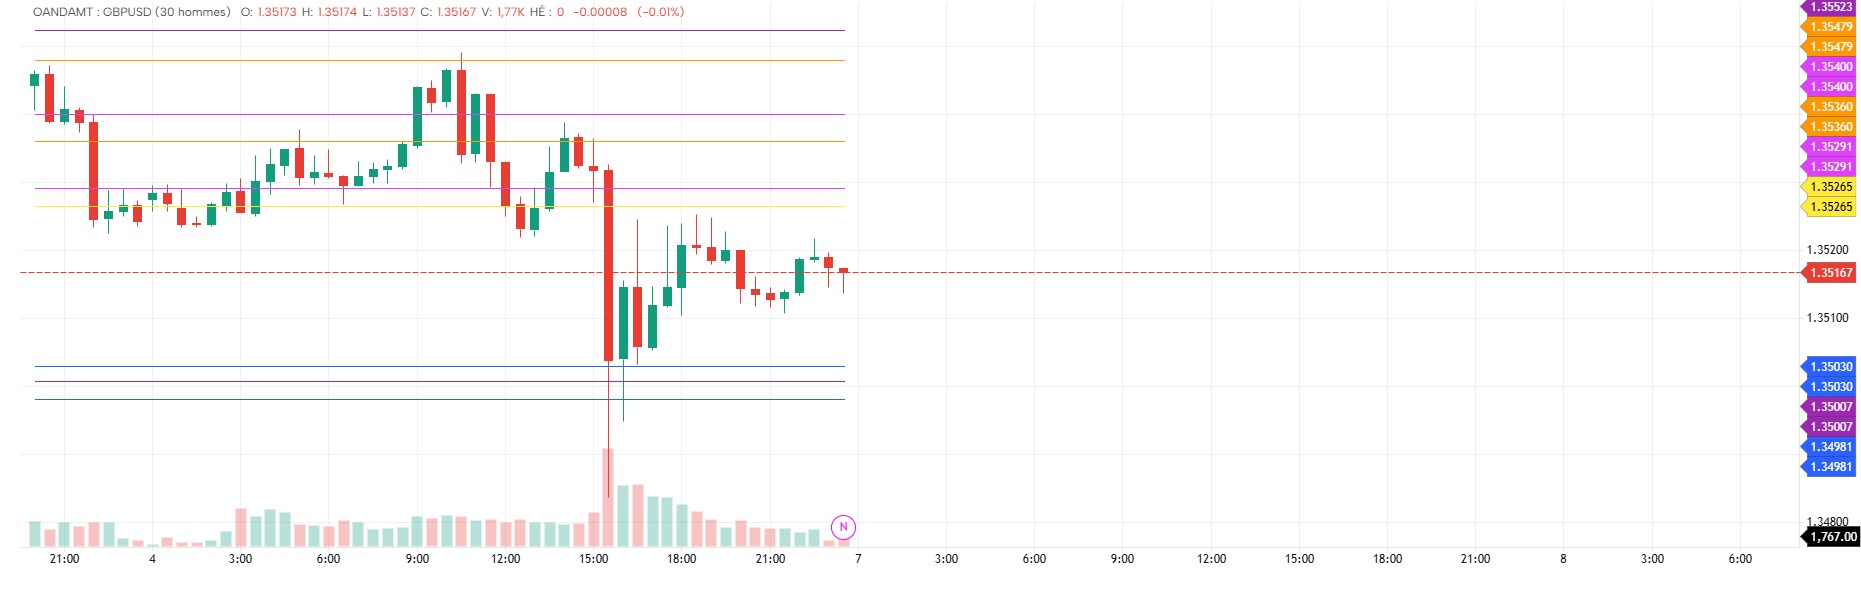
CRT PRINCI
CRT ALGO — CRT Master GoCharting est un indicateur basé sur la stratégie Candle Range Theory (CRT). Il identifie automatiquement les zones CRT, les phases de purge (liquidity sweep) et les bougies de confirmation afin de détecter des opportunités BUY / SELL.
 Protected
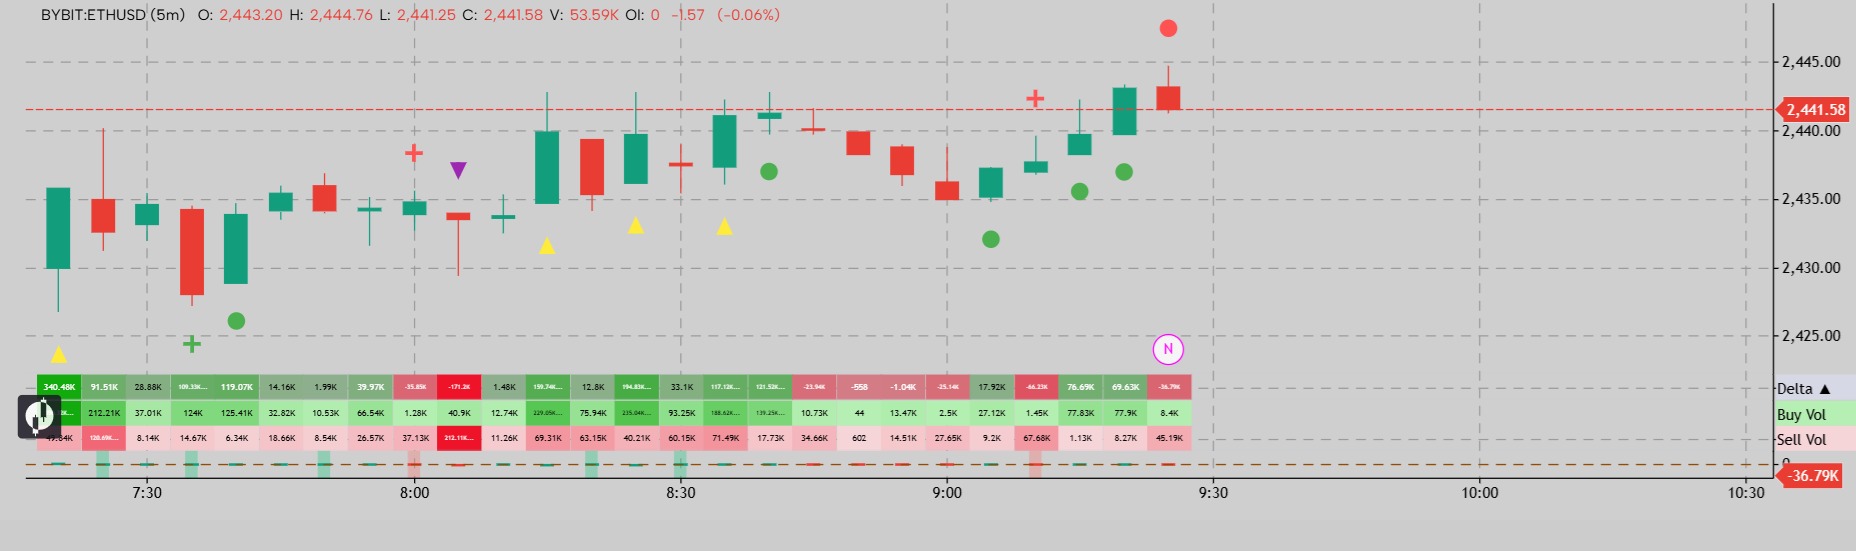
Volume highlighted candles
Highlighting of strong buyer and seller candles based on the strength of the opposing volume within each candle. The purpose is to identify candles where one side clearly dominates despite the presence of opposite-side trading activity.
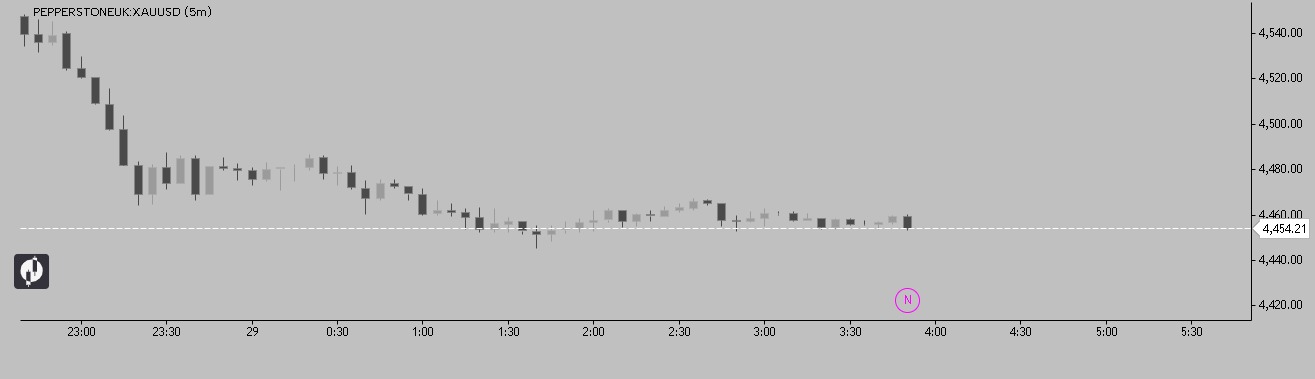
Momentum Candle
momentum candle by rizki aditama sekolah trading — momentum candle adalah suatu candle besar dengan ekor kecil yang menandakan tekanan beli atau jual yang kuat.
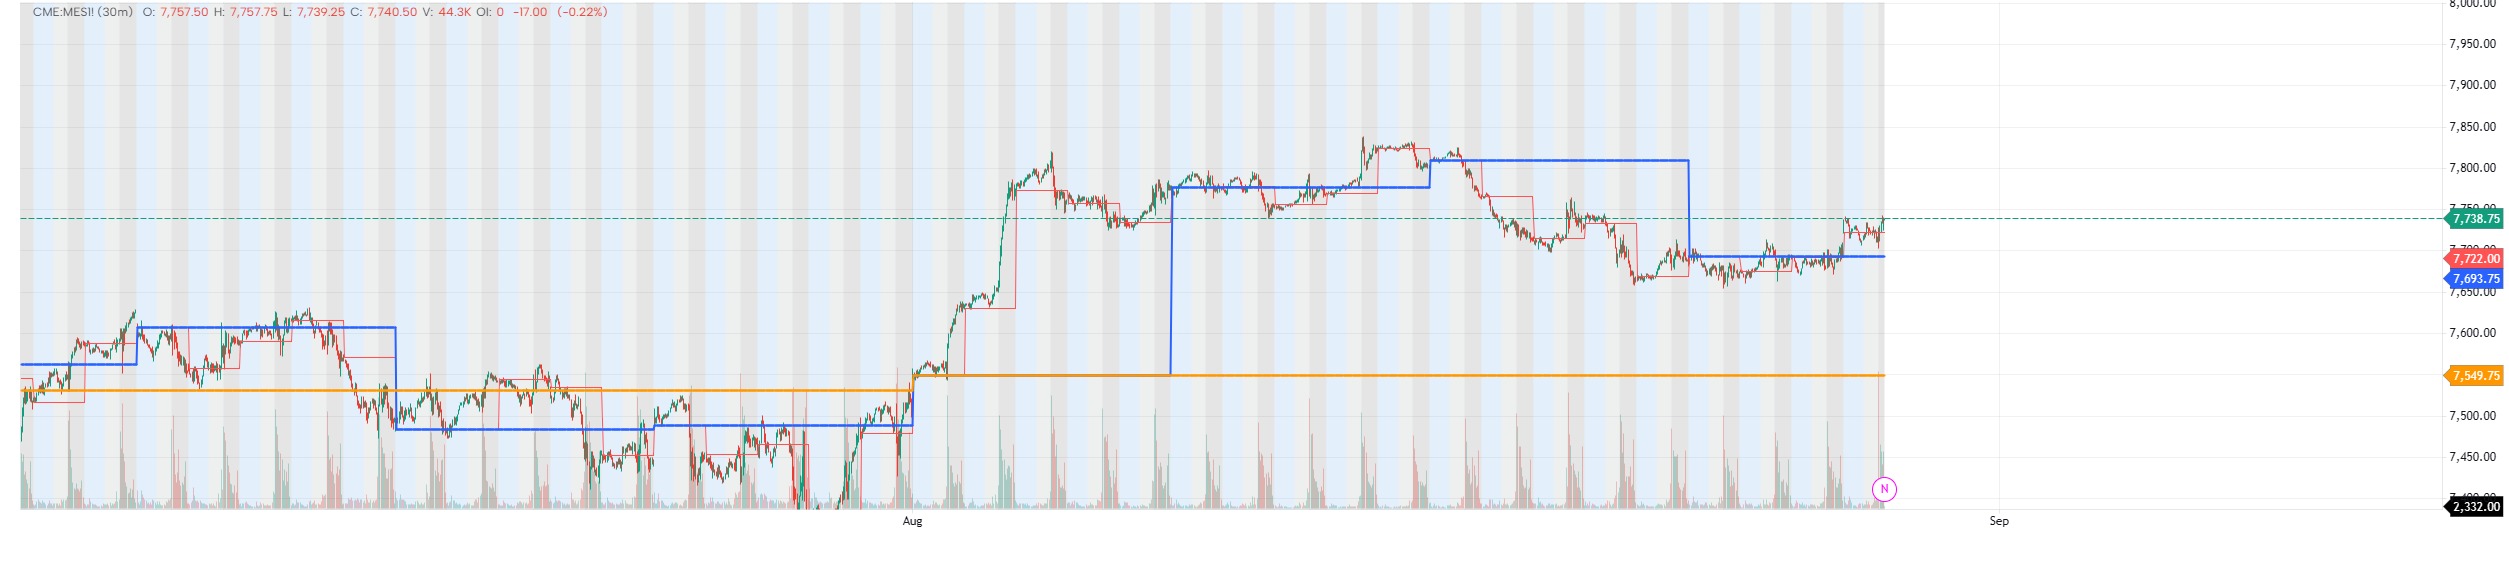
Auction Anchors
Daily • Weekly • Monthly Opens. Markets do not begin at random. Every new day, week and month starts a fresh auction. This indicator plots the levels institutions actually use as reference: the Daily Open, Weekly Open and Monthly Open.
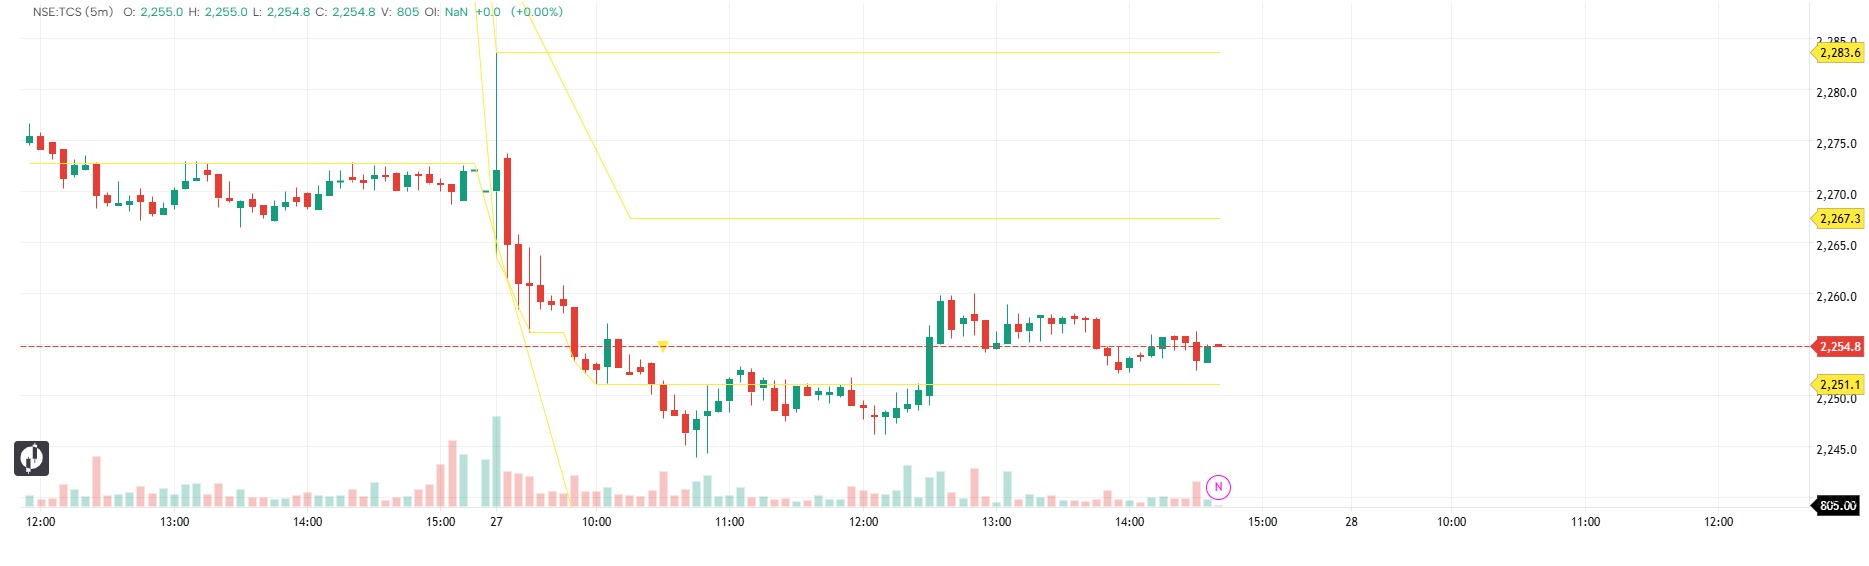
Initial Balance - NSE India
Initial Balance for NSE intraday charts. Default window is 09:15-10:15 IST (first 60 minutes of the regular session). Tracks the running high/low inside the window, locks them when it closes, then plots the midpoint and range extensions.
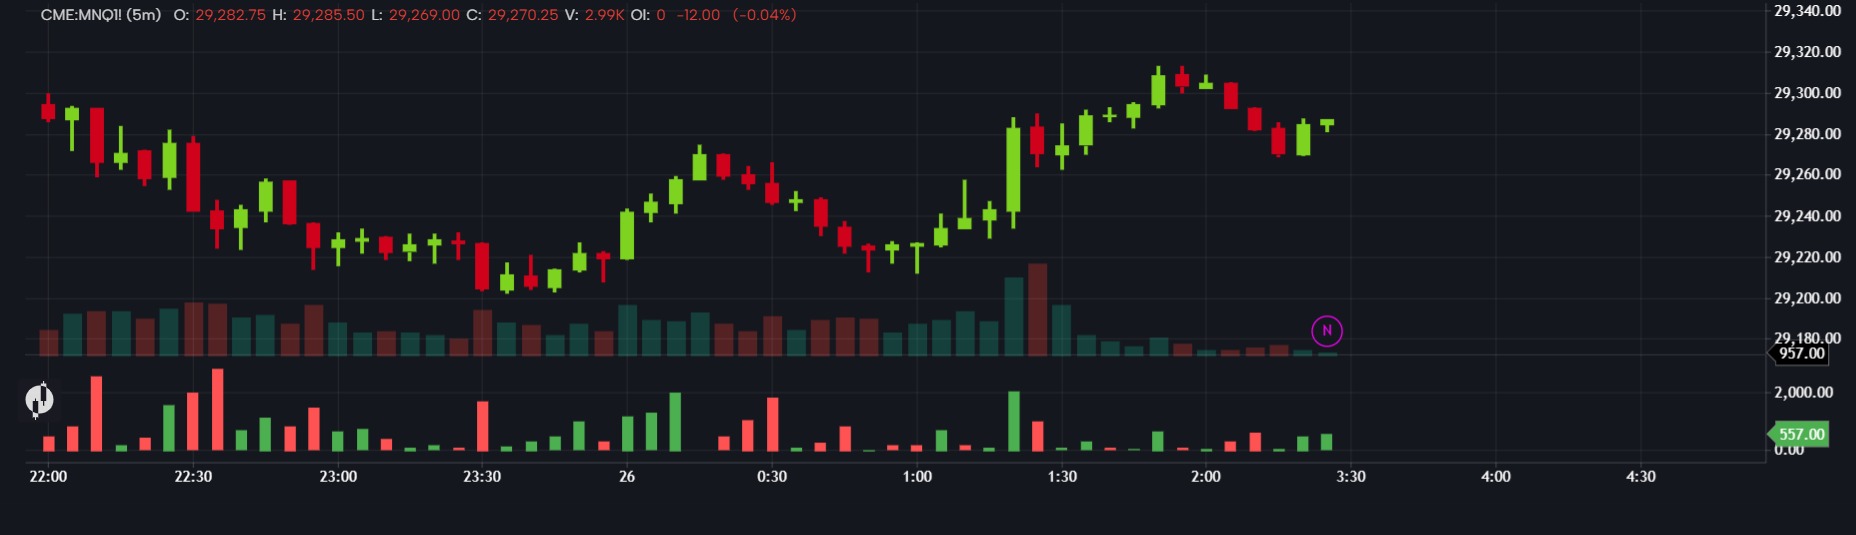
Gom Delta
GomDeltaMomentum is an order-flow momentum indicator designed to track consecutive buying and selling pressure across price bars. It continuously adds volume delta (Market Buys − Market Sells), building a visual wave of sustained market pressure.
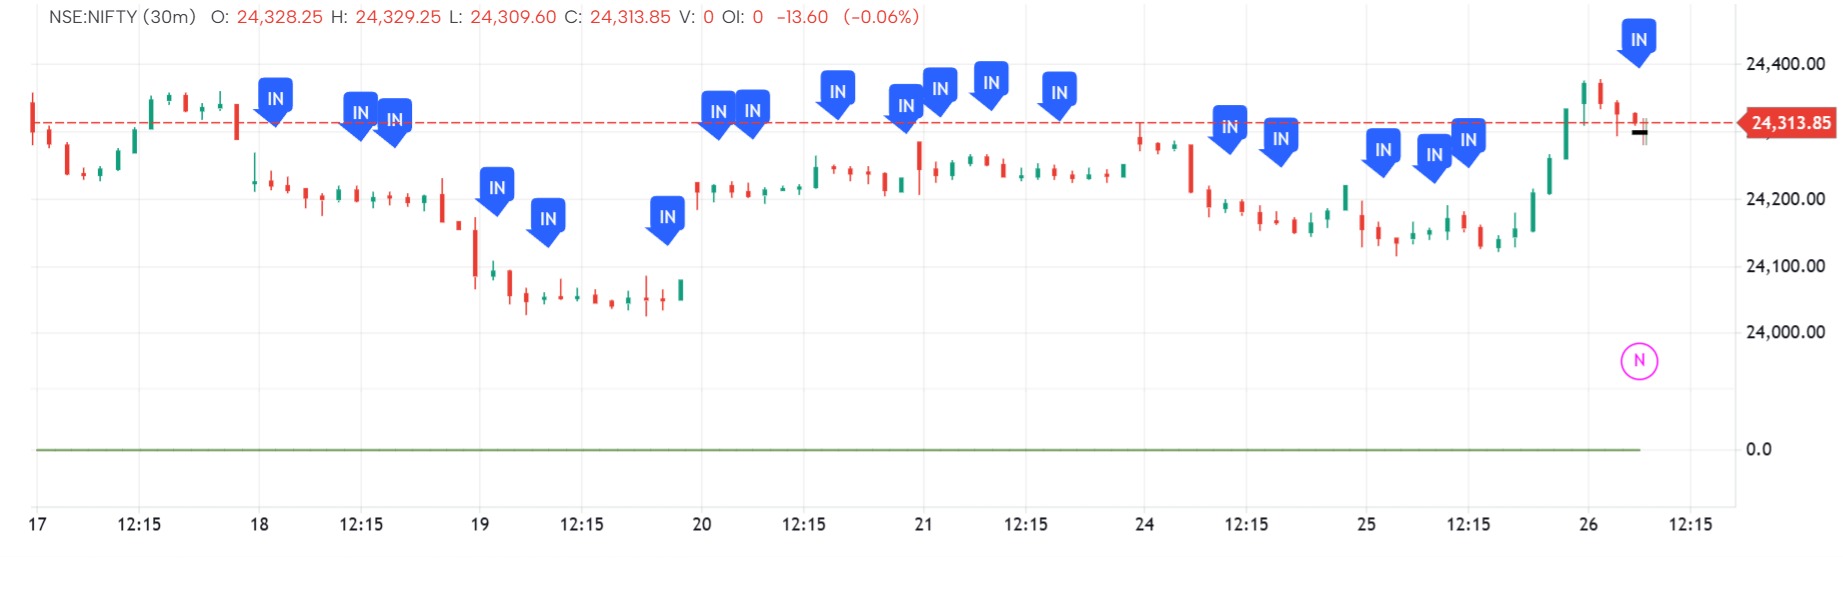
VOLUME CROSS OVER ALERT
The VOLUME CROSS OVER ALERT indicator is designed to identify unusually strong volume activity by detecting when the current volume moves above a predefined statistical threshold, flagging potential participation spikes.
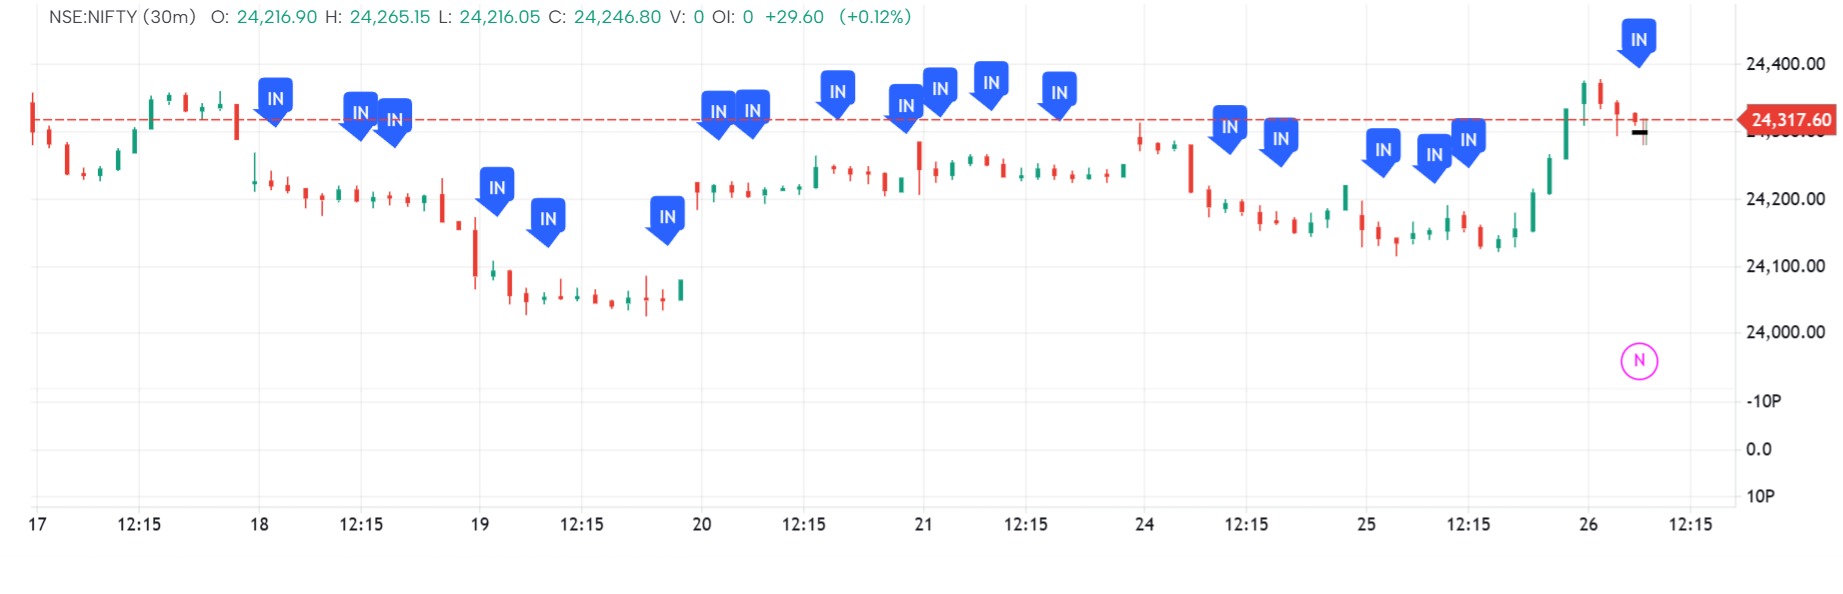
EXTREME RANGE DAY
The INSIDE DAY indicator identifies a classic price-action pattern in which the entire trading range of the current day is contained within the previous day's range, signalling contraction and potential breakout energy.
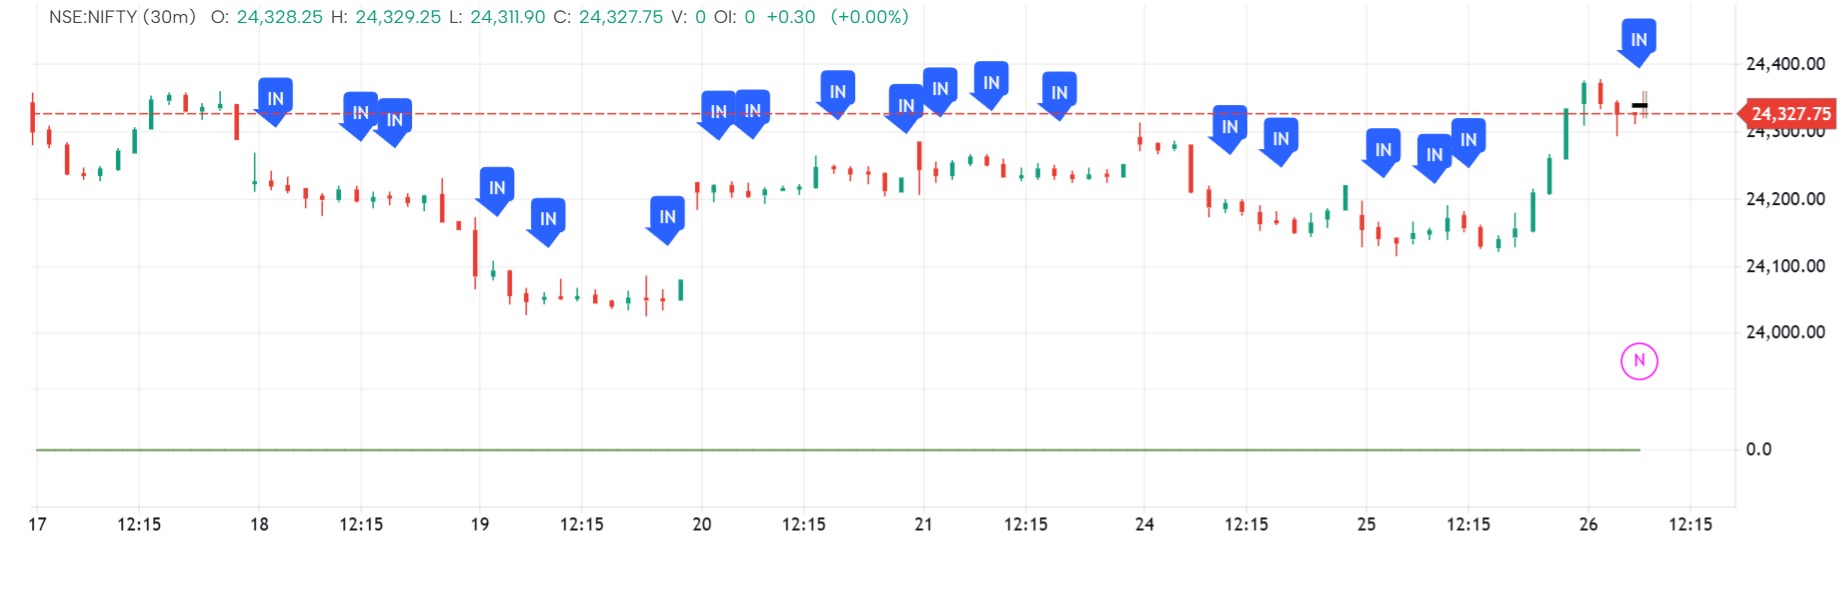
INSIDE DAY
The INSIDE DAY indicator identifies a classic price-action pattern in which the entire trading range of the current day is contained within the previous day's range, signalling contraction and potential breakout energy.